Local SEO Case Studies & Google Maps Results

Screenshots from real client accounts, presented as they were exported. Where a designed summary graphic and a raw platform export disagree, the raw export is the record.

Client names are withheld. Numbers are read directly from the screenshots below — not rounded up, extrapolated, or restated as multiples. Where a metric moved in the wrong direction it is shown and explained rather than cropped out.

Request a Review for My Business

Case 01 — Locksmith · Map Pack · Lancaster, PA

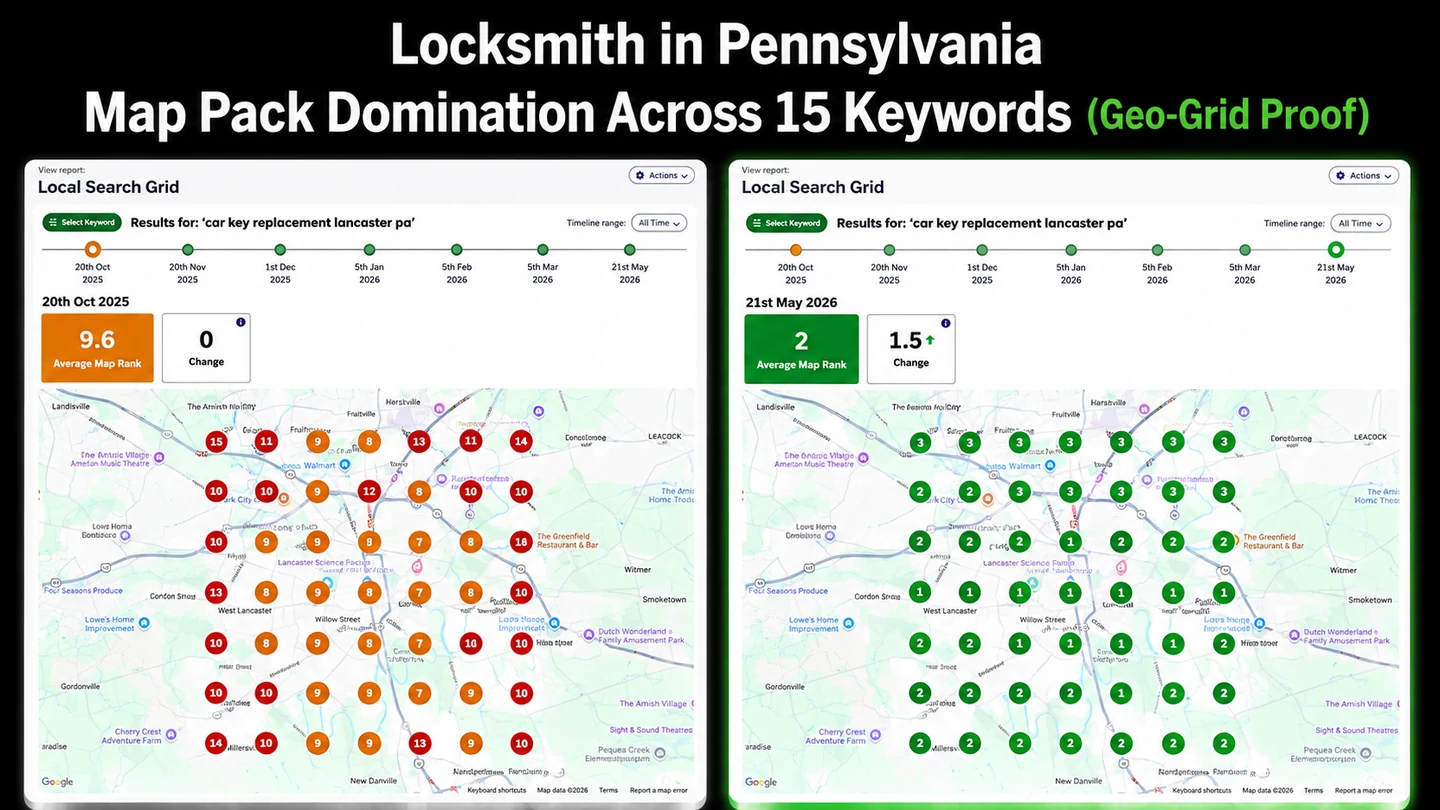
From an average map rank of 9.6 to 2.0

An independent locksmith with reasonable visibility at its own address and very little beyond it. Fifteen priority keywords were tracked on a geo-grid covering the Lancaster service area, from Landisville in the west to Intercourse in the east.
9.6 → 2.0 Average map rank Change readout: 1.5
Top 3 Core area visibility Previously 7–15 at most points
15 Keywords tracked
7 mo Measurement window 20 Oct 2025 → 21 May 2026
Raw export · Local Search Grid
Local Search Grid comparison for a Lancaster, Pennsylvania locksmith: average map rank 9.6 on 20 October 2025 and 2.0 on 21 May 2026 for the keyword car key replacement lancaster pa.
Same keyword, same grid, seven months apart. Left: 20 October 2025, average map rank 9.6. Right: 21 May 2026, average map rank 2, with a change readout of 1.5. Read the grid rather than the average — before, the tracked points read mostly 7 to 15; after, the same points read 1 to 3, including the outer ring. Open full size
Raw export · Local Pack
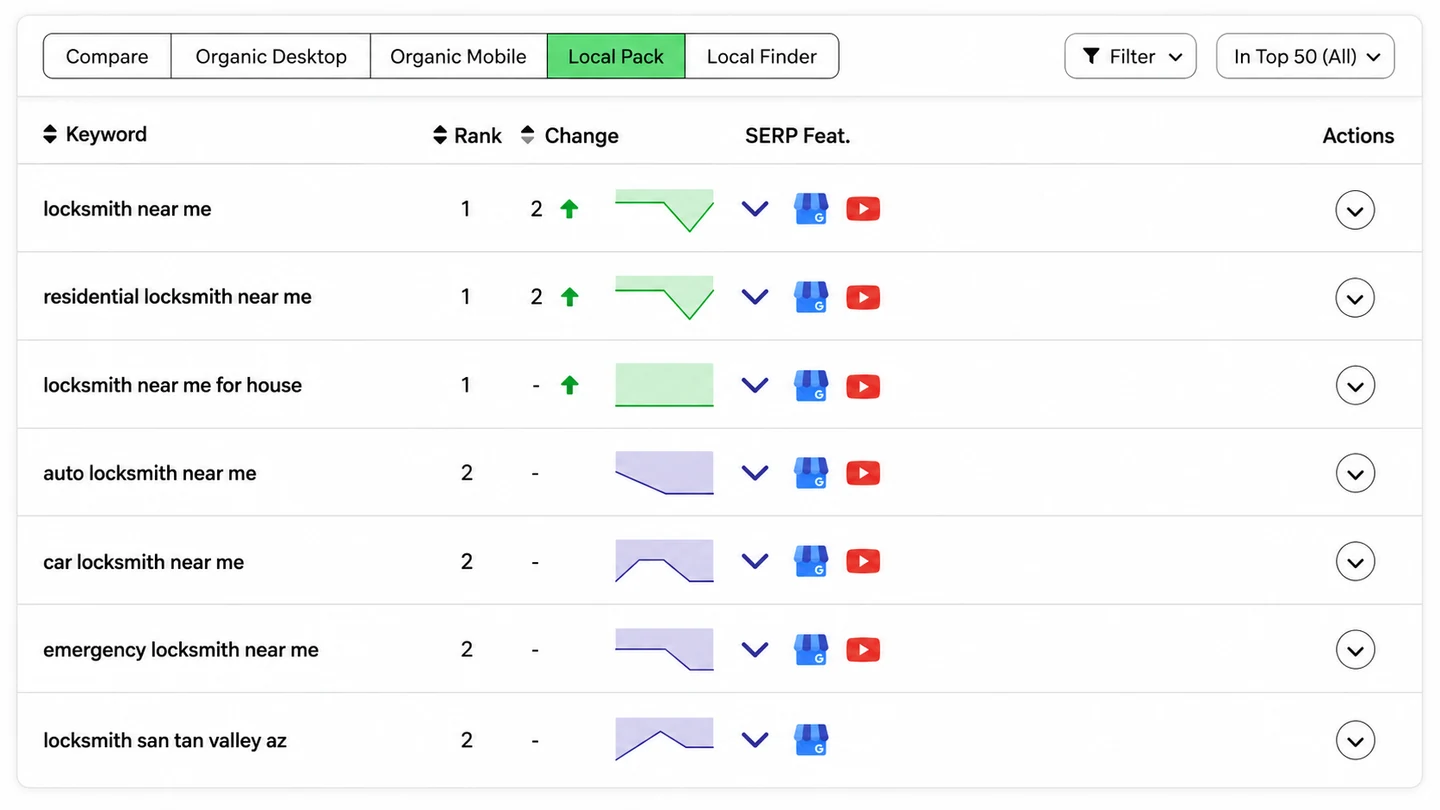
Local Pack rank tracking for locksmith keywords: three keywords at position 1 and four at position 2, including locksmith near me, residential locksmith near me and emergency locksmith near me.
Three keywords at position 1, four at position 2, across head terms including “locksmith near me” and “emergency locksmith near me”. Open full size

What was done

  • Google Business Profile rebuild: categories, services and business information
  • Citation building and NAP cleanup across directories
  • Review request routine and response handling
  • Service page optimization on the website
  • Local Search Grid tracking from the first week, to establish a baseline
Client graphic
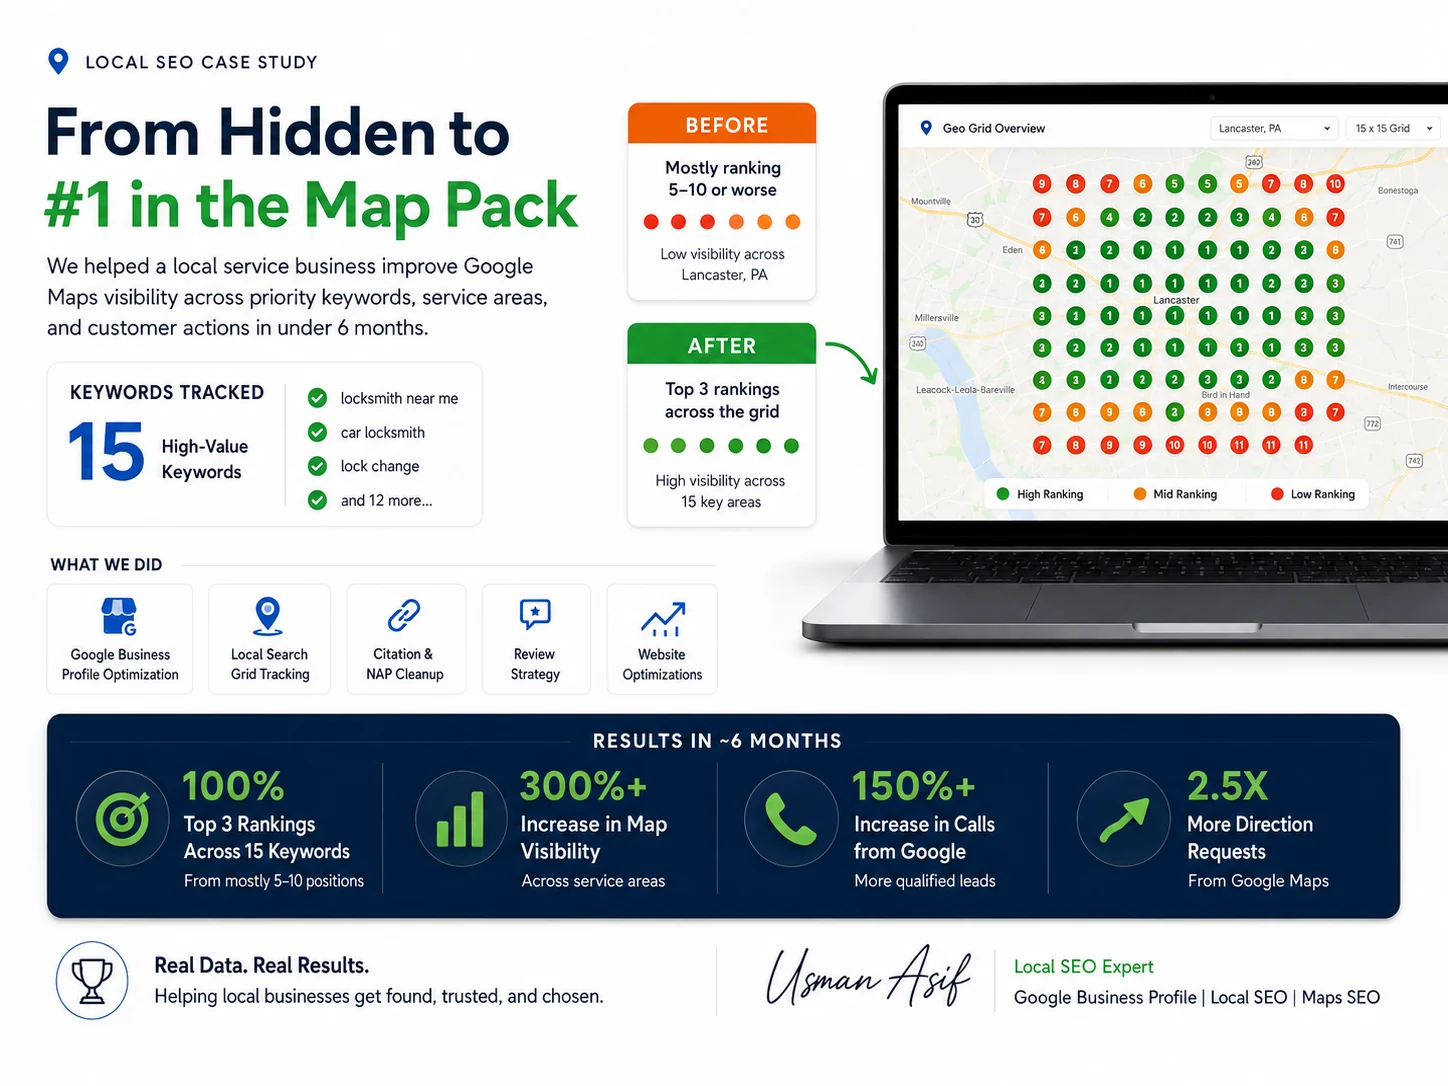
Summary graphic for the locksmith map pack engagement, covering fifteen tracked keywords, GBP optimization, citation and NAP cleanup, review strategy and website optimization.
A summary graphic produced for the client at the end of the engagement. It is a presentation of the work, not a platform export — the two figures above are the record.
Case 02 — Organic search · Search Console & Analytics

Two accounts, two different shapes of growth

Both improved. They improved for different reasons, and the difference is worth understanding before judging any SEO report by its headline number.

Account A — relevance, not reach

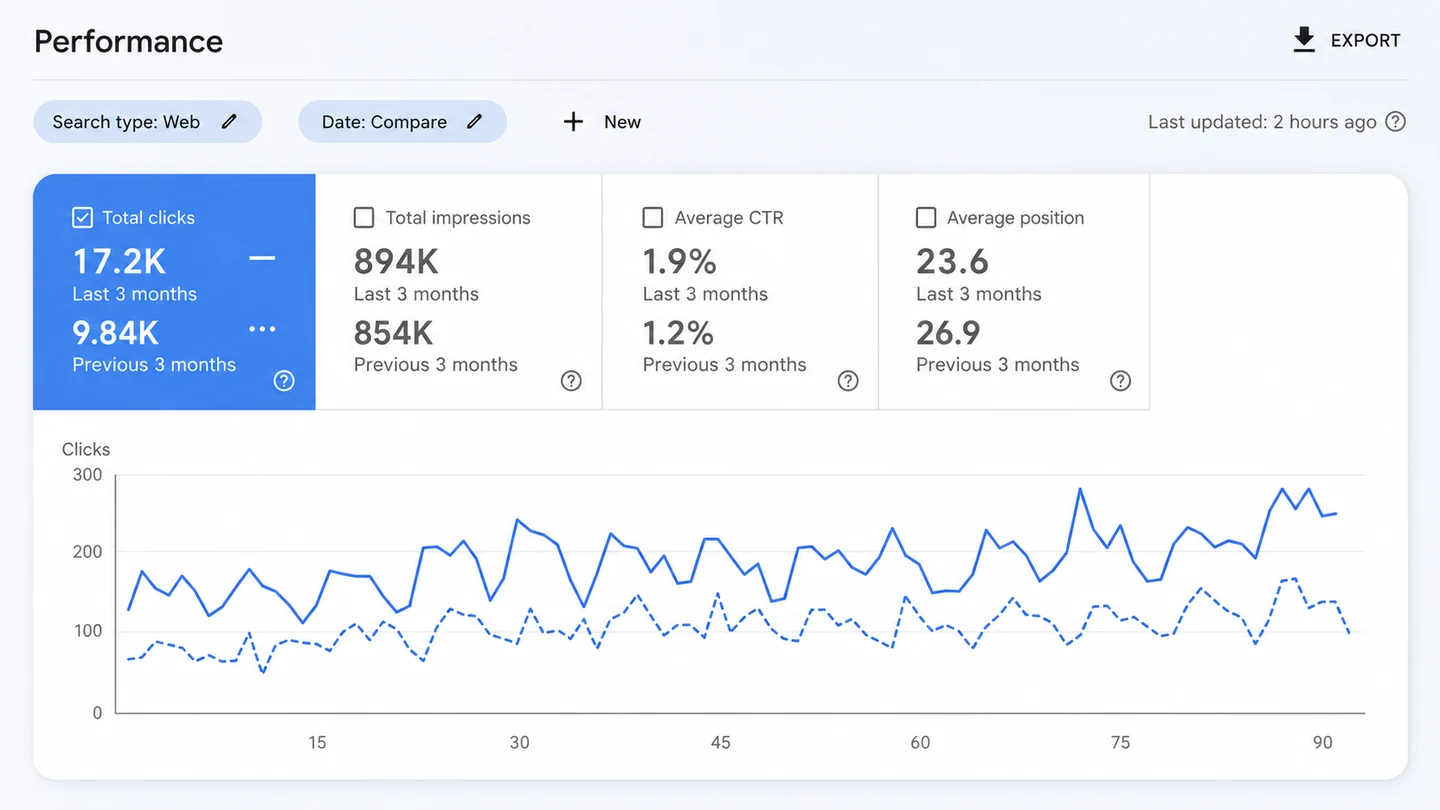
Over a three-month comparison, clicks went from 9.84K to 17.2K while impressions moved only from 854K to 894K. Roughly the same visibility, converted far more efficiently — the signature of on-page, title and intent work rather than new coverage.
17.2K Clicks 9.84K previous 3 months
894K Impressions 854K previous 3 months
1.9% Average CTR 1.2% previous 3 months
23.6 Average position 26.9 previous 3 months
Raw export · Search Console
Google Search Console performance comparing the last three months with the previous three months: 17.2K clicks against 9.84K, 894K impressions against 854K, CTR 1.9 percent against 1.2 percent, average position 23.6 against 26.9.
The impression line barely separates while the click line lifts clearly — the visual signature of a CTR and position improvement rather than a coverage increase. Open full size

Account B — wider coverage

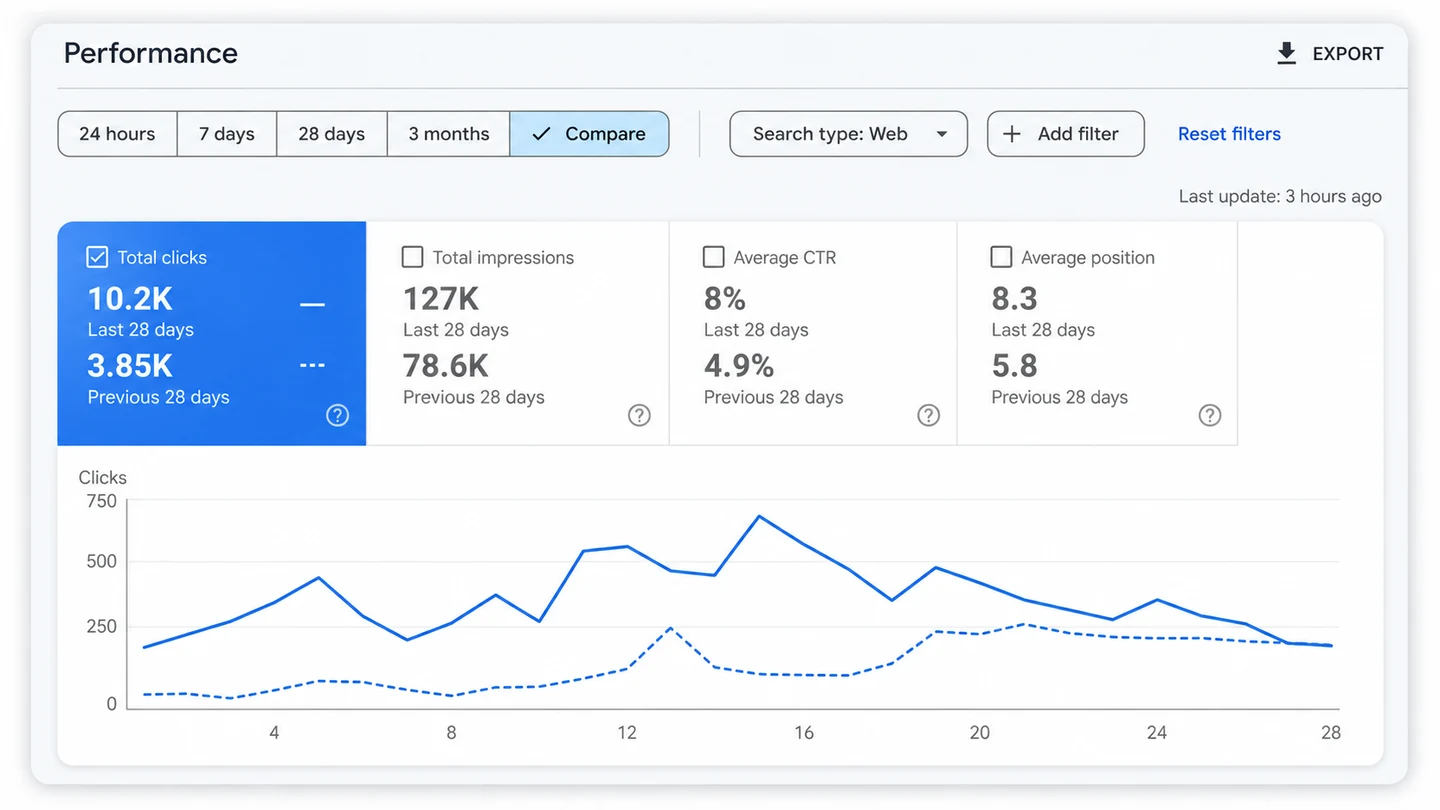
Over a 28-day comparison, clicks went from 3.85K to 10.2K, impressions from 78.6K to 127K and CTR from 4.9% to 8%. Average position moved from 5.8 to 8.3 — a decline. The site began ranking for a much broader set of queries, and the newer terms entered lower down and pulled the average with them.
10.2K Clicks 3.85K previous 28 days
127K Impressions 78.6K previous 28 days
8% Average CTR 4.9% previous 28 days
8.3 Average position — declined 5.8 previous 28 days
Raw export · Search Console
Google Search Console 28-day comparison: 10.2K clicks against 3.85K, 127K impressions against 78.6K, CTR 8 percent against 4.9 percent, average position 8.3 against 5.8.
Average position is an average across every query a site is served for. It gets worse when a site starts ranking for more things, which is usually good news. Reporting it honestly is the only way the number stays useful. Open full size
Raw export · GA4
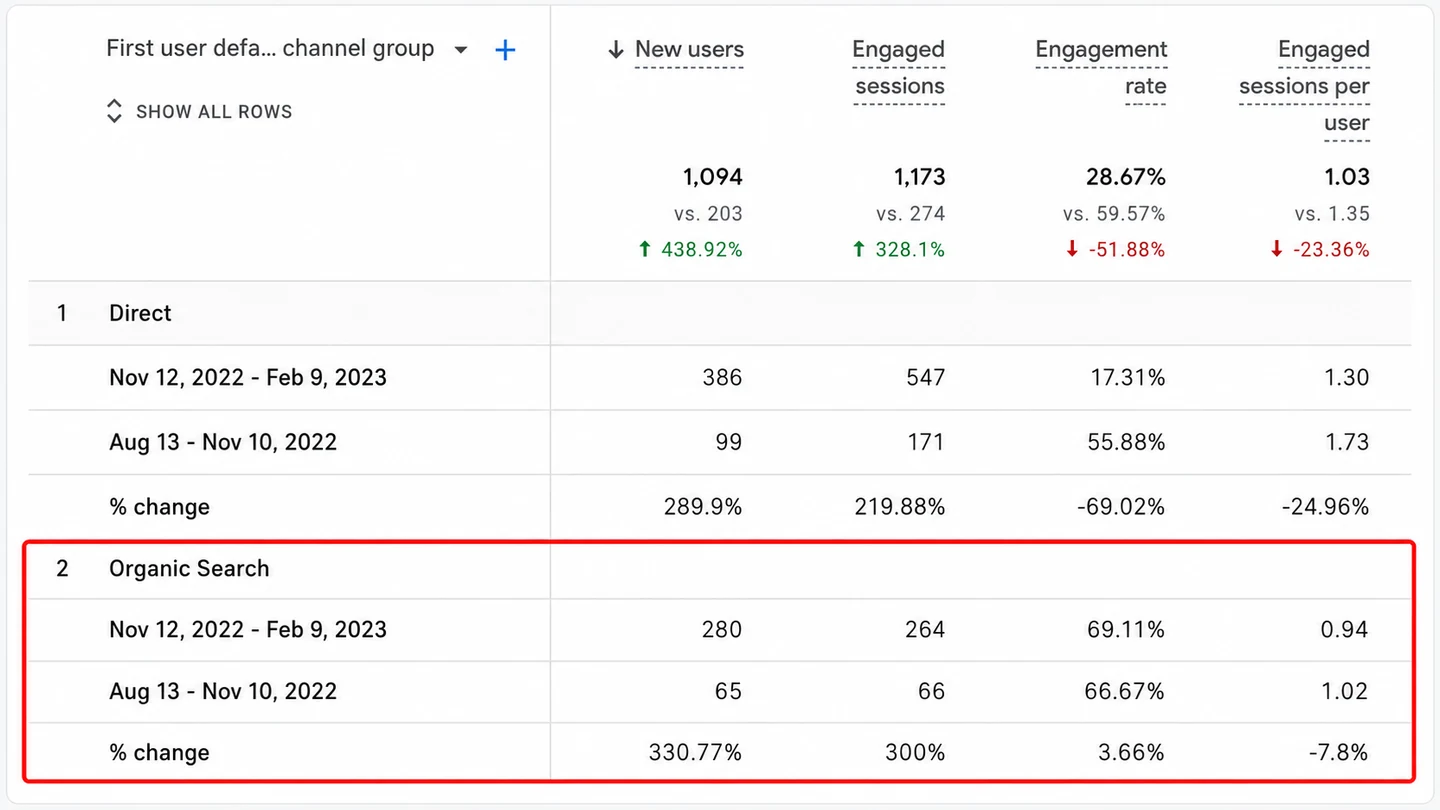
Google Analytics 4 channel comparison highlighting the Organic Search row: new users 65 rising to 280 and engaged sessions 66 rising to 264 between two 90-day periods.
Organic search channel only (highlighted row). New users 65 → 280, engaged sessions 66 → 264, engagement rate 66.67% → 69.11%. Periods: 13 Aug – 10 Nov 2022 against 12 Nov 2022 – 9 Feb 2023. Open full size
Client graphic
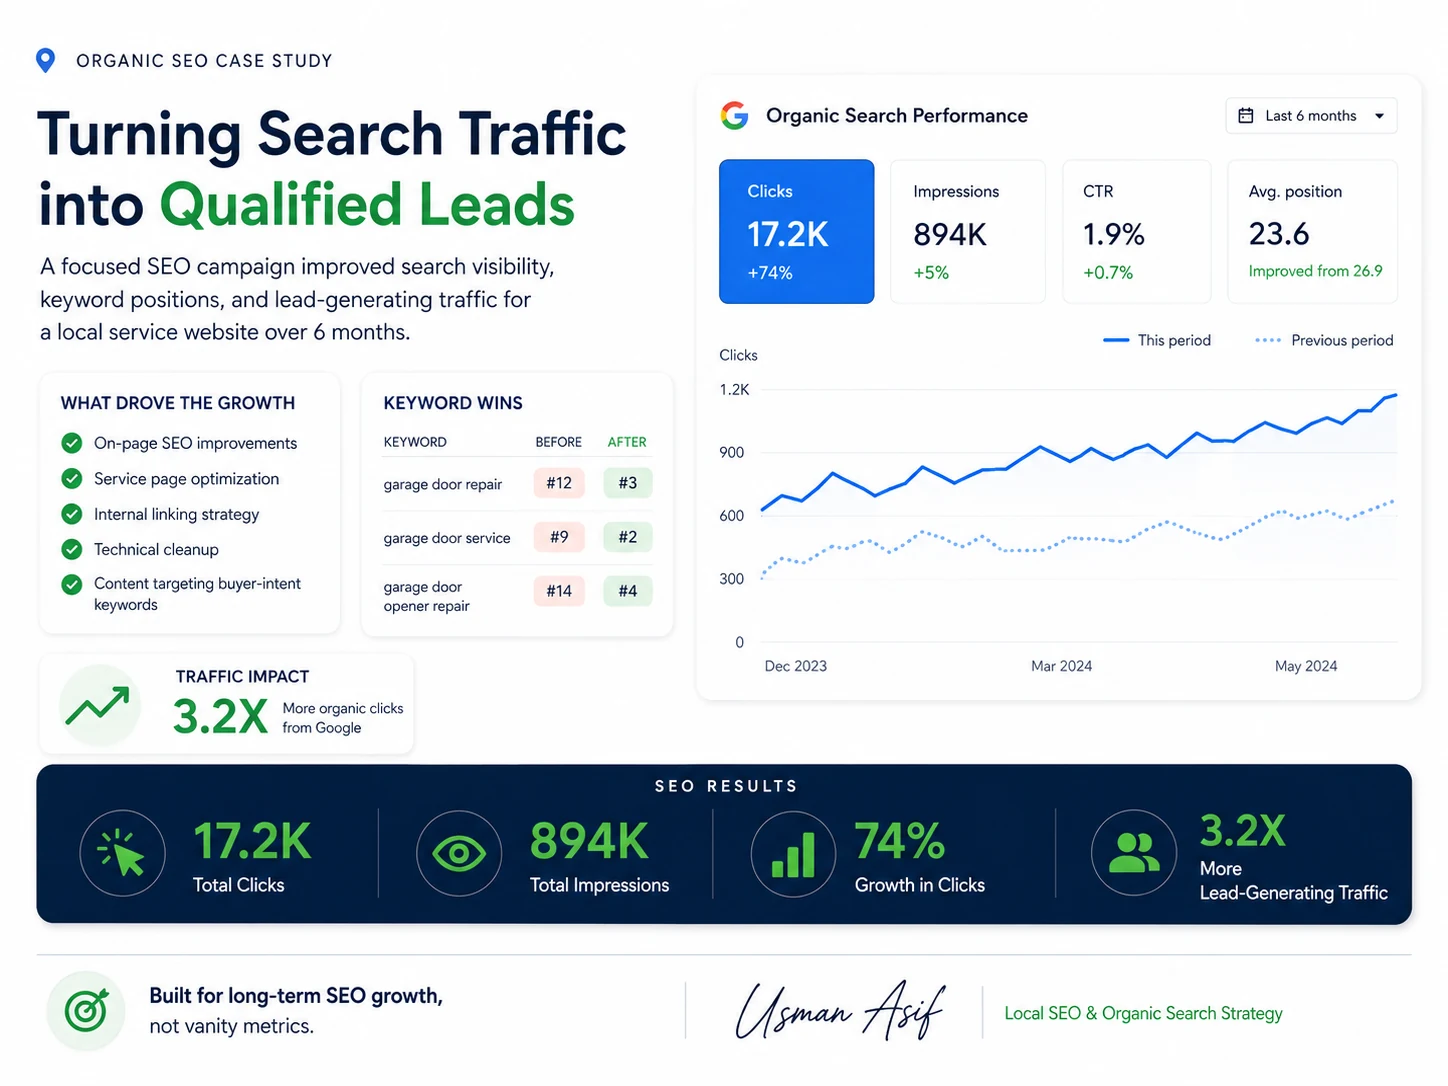
Summary graphic for a garage door company's organic SEO engagement, listing on-page improvements, service page optimization, internal linking, technical cleanup and buyer-intent content.
Summary graphic for the garage door engagement behind Account A. It restates the click growth as a multiple; the Search Console export above — 17.2K against 9.84K — is the figure to work from.
Case 03 — Storage facility · Local Pack & GBP

Position one across the core storage terms

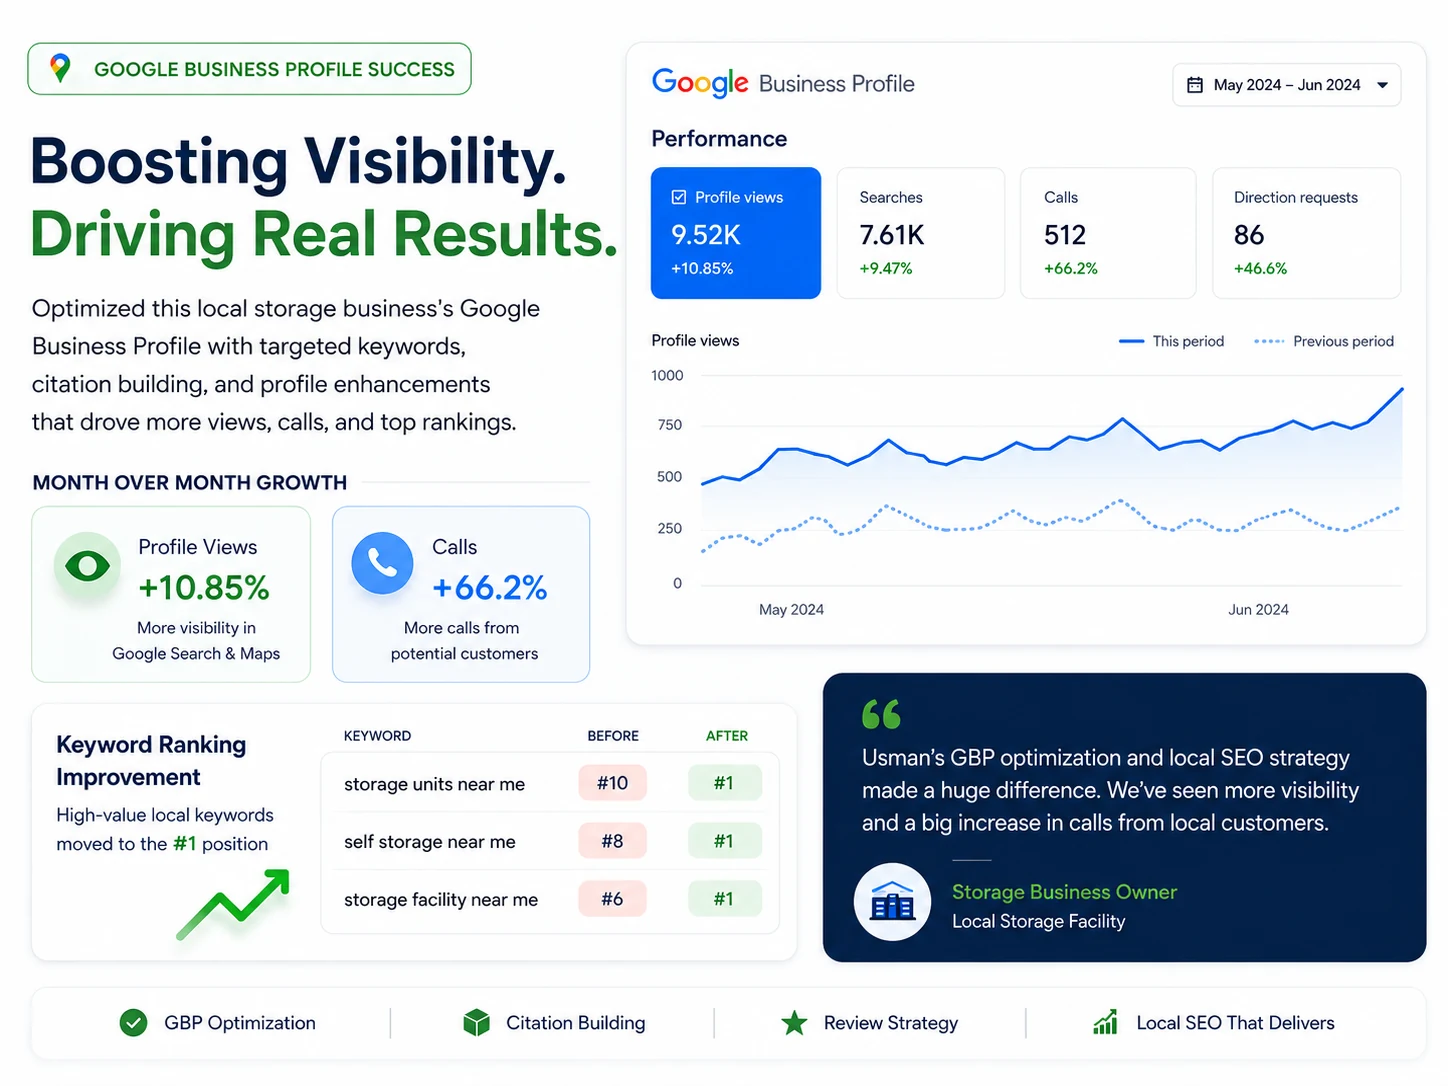
A local storage facility competing on high-intent “near me” searches, where the Map Pack decides almost everything. Profile optimization, citation building and targeted keyword work moved the head terms to the top of the Local Pack.
5 Keywords at Local Pack position 1
3 Further keywords at position 2
8 Head terms tracked in the top 50
Raw export · Local Pack
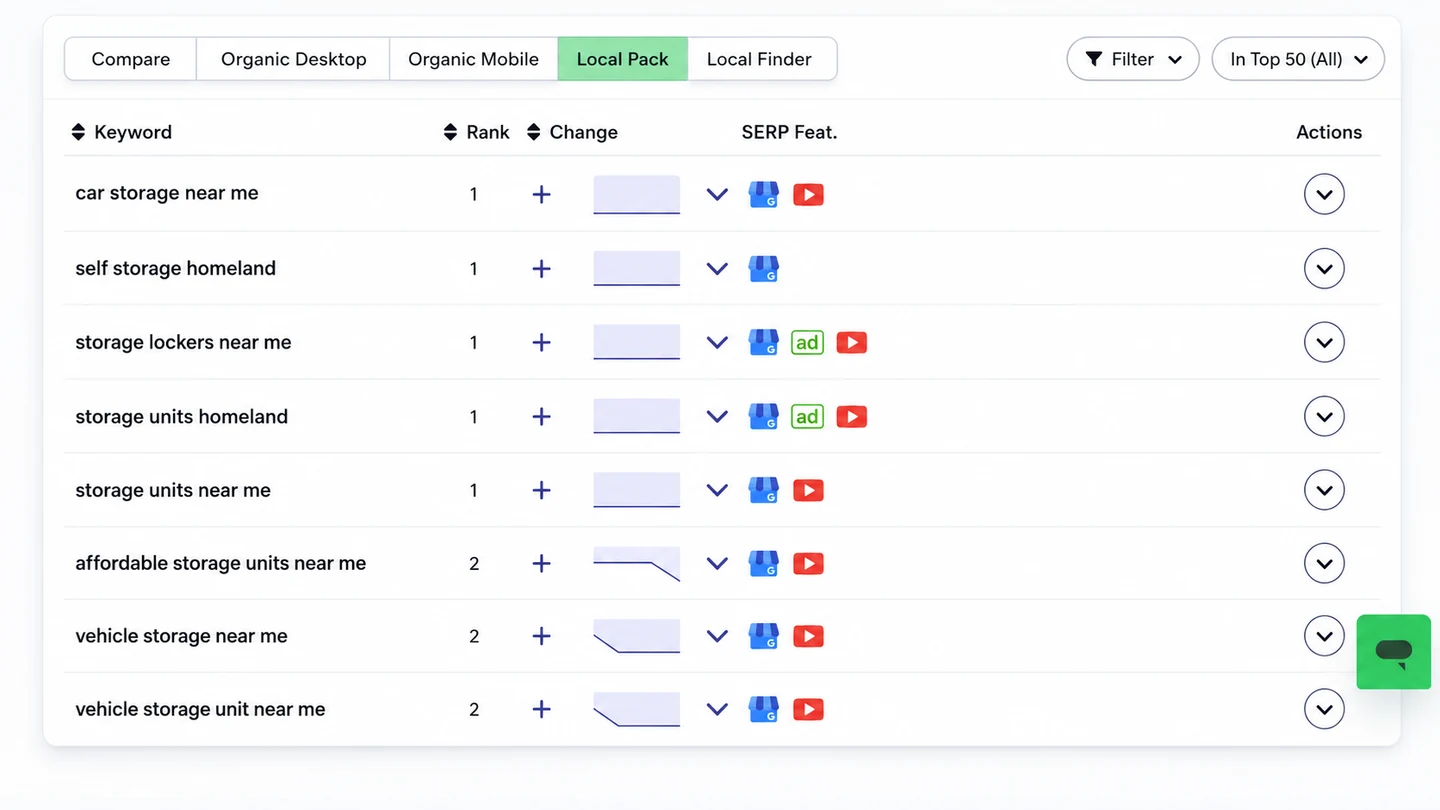
Local Pack rank tracking for a storage facility showing five keywords at position 1 and three at position 2, including storage units near me and vehicle storage near me.
Five keywords at position 1: car storage near me, self storage homeland, storage lockers near me, storage units homeland, storage units near me. Two of them appear alongside paid ads, which makes holding the top organic Map Pack slot more valuable, not less — it is the first non-paid result the searcher sees. Open full size
Client graphic
Summary graphic for a storage facility's Google Business Profile engagement, covering profile views, searches, calls and direction requests over May to June 2024.
Summary graphic covering the same engagement, including the client's own comment on the work. Profile performance figures shown here come from the client's Google Business Profile insights for May–June 2024.
Case 04 — Multi-location · Five service areas

Holding visibility across five cities at once

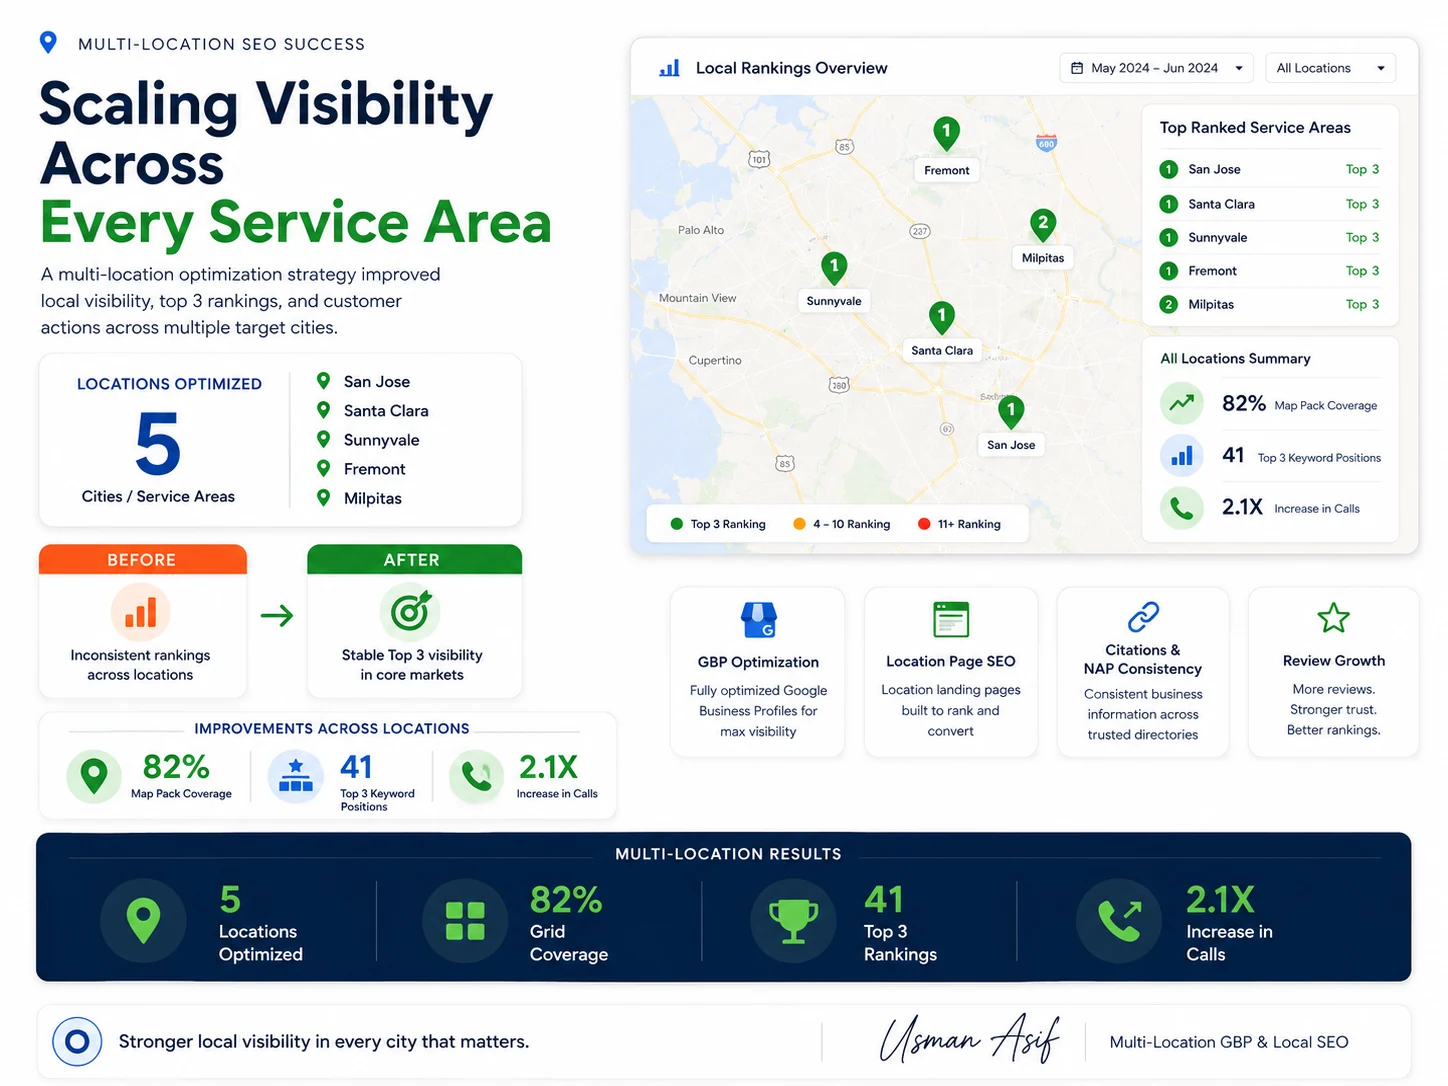
San Jose, Santa Clara, Sunnyvale, Fremont and Milpitas. The problem was not that the brand could not rank — it was that rankings were inconsistent between markets, because the profiles and location pages had been set up at different times by different people.
Client graphic
Multi-location Local SEO summary graphic covering five South Bay service areas: San Jose, Santa Clara, Sunnyvale, Fremont and Milpitas, with top three ranking status per city.
Five locations, each tracked separately, with top-three status shown per city. Milpitas sits at position 2 while the other four hold position 1 — the kind of per-market difference that only shows up when locations are measured individually. Open full size

What was done

  • Standardised Google Business Profile structure across all five locations
  • Location landing pages rebuilt to be genuinely distinct from one another
  • Citation and NAP consistency work across every location
  • Review growth routine per location
  • Per-location rank tracking, so each market could be judged separately

The coverage, top-three and call figures in the graphic are drawn from the client's own reporting for May to June 2024 and are presented as a summary of that engagement. There is no raw platform export in this archive for those numbers, so treat them as engagement reporting rather than as a verified screenshot.

How Multi-Location Engagements Work

Case 05 — Technical performance · Core Web Vitals

A mobile PageSpeed score of 98

Page speed is not a Local SEO tactic, but a slow site puts a ceiling on everything else — particularly on mobile, where most local searches happen and where a two-second delay costs calls before the page has finished loading.
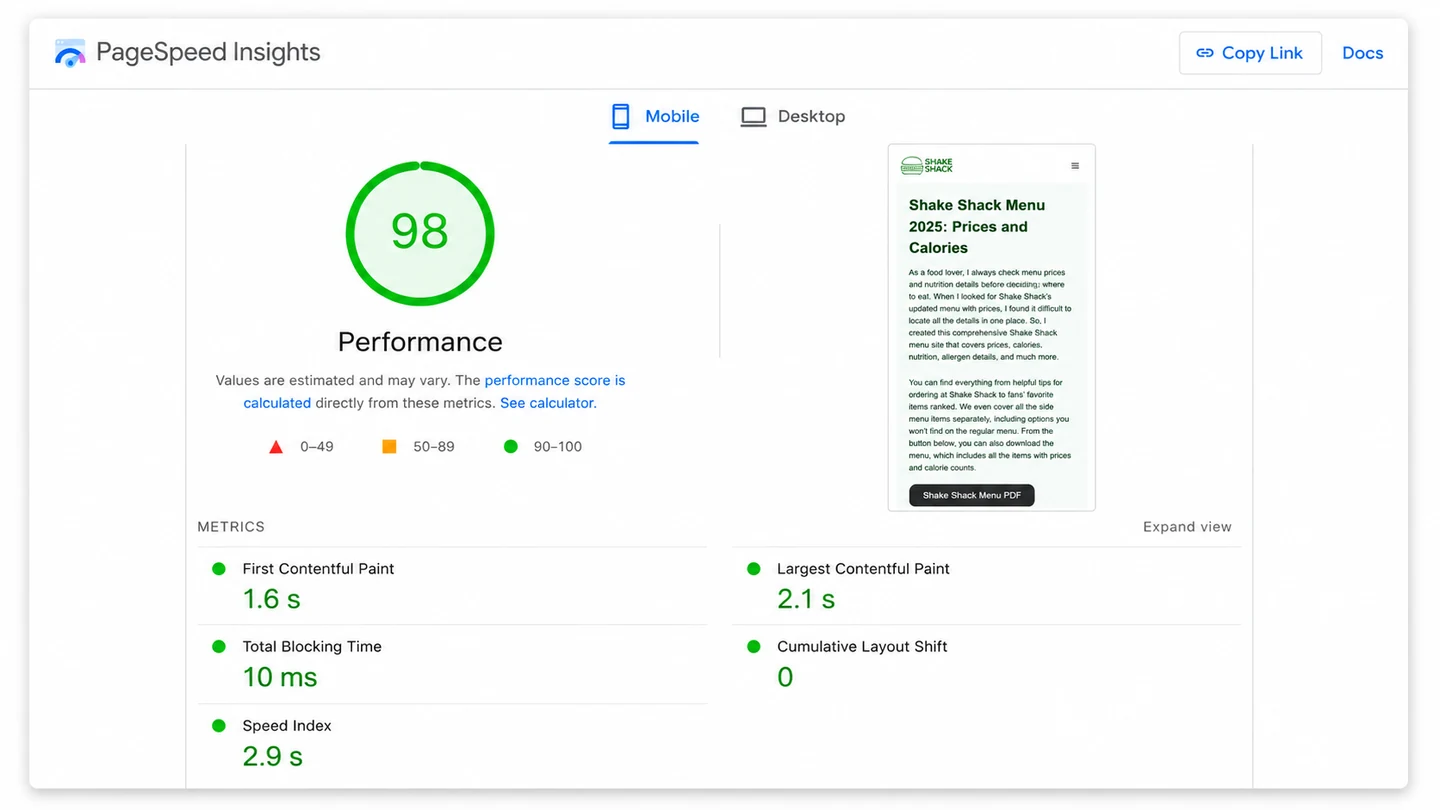
98 Performance, mobile
2.1s Largest Contentful Paint
1.6s First Contentful Paint
0 Cumulative Layout Shift
Raw export · PageSpeed Insights
PageSpeed Insights mobile report showing a performance score of 98, first contentful paint 1.6 seconds, largest contentful paint 2.1 seconds, total blocking time 10 milliseconds and cumulative layout shift of zero.
All five reported metrics in the green band. Open full size

Total Blocking Time measured 10ms and Speed Index 2.9s.

The work behind it is ordinary: image conversion and compression, lazy loading below the fold, removing render-blocking resources, caching, and eliminating layout shift by reserving space for images.

How to read this archive

  • Screenshots are unedited exports from client Search Console, Analytics, PageSpeed and rank-tracking accounts.
  • Summary graphics are labelled as such. They were produced for clients and are presentations of the work, not platform data.
  • Where a graphic and a raw export disagree, the raw export is correct.
  • Metrics that declined are shown and explained rather than removed.
  • Client names are withheld; industry and market are given where they matter to the result.
  • Past results describe past engagements. They are evidence of method, not a forecast for another business.

Want to see this kind of data for your own business?

Send me your business name, website and service area. I will run a geo-grid scan and a profile review, and reply by email with the findings.